Japanese Company Financial Indicators
TOP
PAGE
1000
- 1999
2000
- 2999
3000
- 3999
4000
- 4999
5000
- 5999
6000
- 6999
7000
- 7999
8000
- 8999
9000
- 9999
ROE, ROA
Revenue
Income
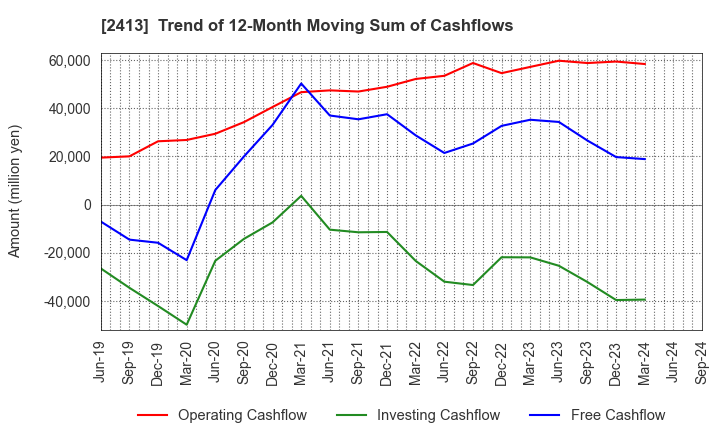
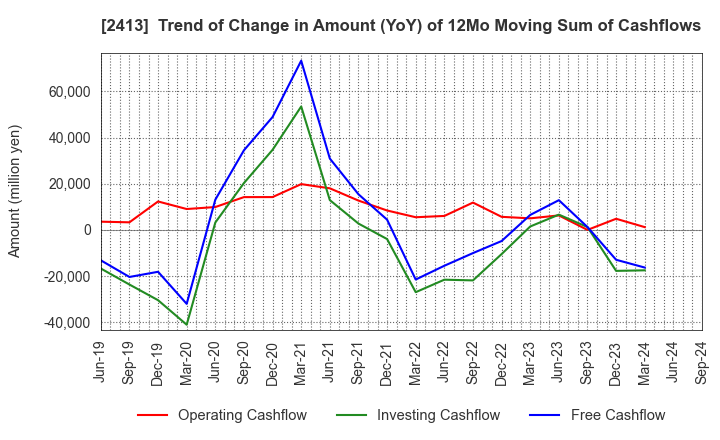
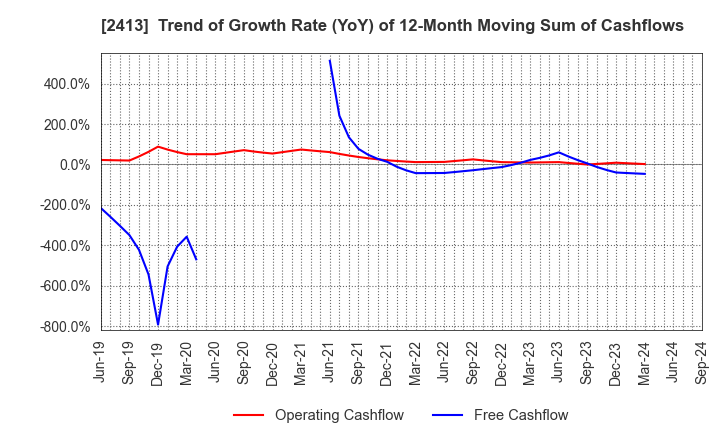
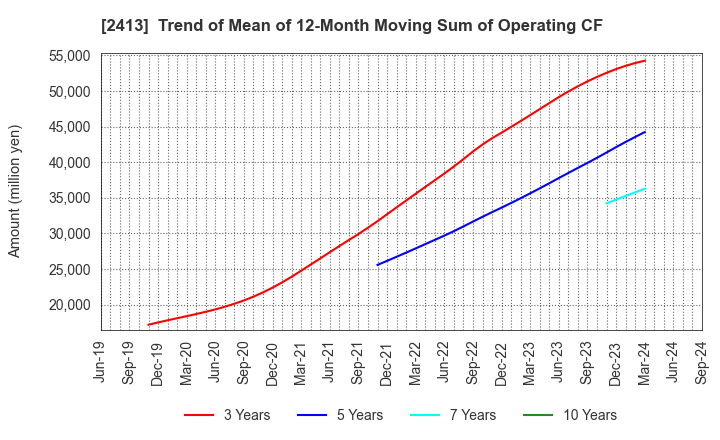
Cashflow
Margin
Ratio to T.Assets
Curr/Fixed Ratio
Turnover
CF Ratio
Top Page
> M3, Inc.
M3, Inc.
Last Updated on
2/4/2026
[Issuer Code]
Go